Table of Contents
Unique Challenges Mid-Market Businesses Face in Managing KPIs
The Role of KPIs in Mid-Market Business Success
- Key Performance Indicators
- KPIs Promote Business Alignment
- Challenges in KPI Management for Mid-Market Businesses
The Eight Essential Features of KPI Dashboards
- Dashboard Customization and Flexibility
- Real-Time Data Integration
- A User-Friendly Interface
- Advanced Analytics and Predictive Insights
- KRI-Adjusted KPIs
- Collaboration and Communication
- Automation of Manual Tasks
- Scalability and Integration
- Elevate Your KPI Management for Success
- Is It Time to Upgrade Your KPI Dashboard?
- Take the Next Step with Lumify360
Introduction
Data drives the business world. Mid-market businesses face a constant demand to optimize performance, streamline operations, and make informed decisions to compete effectively with peers and larger incumbents. Key Performance Indicators (KPIs) serve as the benchmarks against which success is measured. However, a lack of expertise and resources prevents mid-sized businesses from fully realizing the potential of KPIs.
Consider key performance indicator dashboards, which have emerged as indispensable tools that empower businesses to visualize, monitor, and analyze critical metrics in real time. By presenting complex data in a simplified, visual format, KPI dashboards enable business leaders to gain actionable insights, identify trends, and make data-driven decisions that propel their companies forward.
Whether tracking sales performance and customer satisfaction or managing financial health, KPI dashboards provide the clarity and focus needed to measure progress against strategic plans for mid-market companies. Medium-sized businesses often operate with limited resources but high ambitions. Gaining the ability to manage and leverage KPIs effectively can be the difference between stagnation and growth.
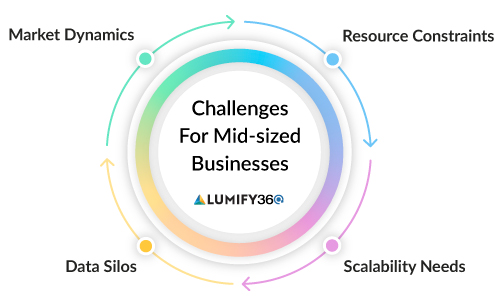
Unique Challenges Mid-Market Businesses Face in Managing KPIs
- Resource Constraints: Mid-market businesses generally have fewer human resources for advanced data management and analytics. This creates difficulties in gathering, analyzing, and interpreting all the relevant data required to track and manage KPIs accurately.
- Scalability Needs: As businesses grow, their KPI management systems must also grow accordingly. However, scaling KPIs is often complex and costly, as business systems are not flexible and robust enough to handle increasing data volumes and complexity.
- Data Silos: In many mid-market businesses, data is often spread across different departments and unconnected systems. This fragmentation hinders an organization’s ability to create a unified view of business overall performance, making it hard to track and manage KPIs effectively.
- Adaptation to Market Dynamics: Mid-market businesses must continuously navigate an ever-changing market environment. Customer demands, competitive pressures, and regulatory requirements change with time. This is why KPI dashboards that are adaptable and responsive to external changes are critical.
Given these challenges, choosing the right KPI dashboard software is vital for mid-market businesses. This guide will help business leaders identify essential features that KPI dashboard tools should have to meet the unique needs of mid-market organizations. Our goal here is to focus on key performance indicator dashboard features that cater to several industries instead of limiting the discussion to one sector in particular. Understanding essential KPI dashboard features will help businesses overcome common obstacles, optimize operational performance, and drive sustained growth and success.
The Role of KPIs in Mid-Market Business Success
Key Performance Indicators
Key Performance Indicators are the lifeblood of any performance-driven organization. For mid-market businesses, KPIs can be particularly crucial because they provide precise, quantifiable measures of success across various operational areas. Drawing from effective KPI dashboard examples, businesses can better visualize and track these metrics. KPIs help break down complex business strategies into manageable, actionable components. By translating broad organizational objectives into specific operational performance metrics, KPIs can track and monitor progress, identify issues and problems early on, and enable business leaders to adjust tactics on time.
KPIs Promote Business Alignment
Aligning KPIs with business objectives ensures that every effort within the organization contributes to overarching goals. For example, a mid-market business focused on growing its market share can track KPIs such as customer acquisition cost, lifetime value, and market penetration rates. By focusing on these metrics, businesses ensure that their marketing, sales, and product development efforts work harmoniously toward the same strategic aim.
KPIs also play a crucial role in fostering accountability within organizations. When KPIs are clearly defined and communicated, each team member understands how their individual performance impacts the business. This approach not only reinforces focus but also motivates employees by giving them a clear sense of purpose and direction.
Challenges in KPI Management for Mid-Market Businesses
While more agile than large enterprises, mid-market businesses still face several unique challenges in managing KPIs. These challenges can significantly impact their ability to leverage KPIs effectively for growth and success:
- Balancing Scalability with Efficiency: One of the primary challenges for mid-market businesses is ensuring that their KPI management processes can scale as the company grows. As organizations expand, the number of KPIs that need to be tracked increases, as does the complexity of the data involved. Without a scalable solution, businesses may find themselves overwhelmed by data, leading to inefficiencies and potential errors in decision-making. Scalable KPI dashboards can easily handle increased data loads, integrate new data sources seamlessly, and even allow the addition of new KPIs as the business evolves—all while maintaining accessibility and keeping things simple for users.
- Customizing KPIs for Different Departments: Another significant challenge is customizing KPIs for different departments. The crucial KPIs for the sales team may differ from what the finance or operations teams need. A one-size-fits-all approach to KPI management can result in incoherent data, leading to missed opportunities and misguided strategies for various departments. Therefore, an effective key performance indicator dashboard should allow for customization at the departmental level to ensure that each team has access to the metrics that matter most to them.
- Navigating Industry Regulations: Many mid-market businesses operate in highly regulated industries, such as finance, healthcare, or manufacturing. Staying compliant with regulations while driving financial performance requires a delicate balance for such critical sectors. Compliance KPIs, such as audit completion rates or regulatory breaches, need to be integrated into the broader KPI framework without overshadowing other essential performance metrics.
- Adapting to Market Changes: Market dynamics can shift quickly, especially in competitive industries like healthcare and finance. Mid-market businesses need to be able to adjust their KPIs quickly in response to these changes. For instance, a sudden shift in consumer buying behavior might necessitate the inclusion of new KPIs related to customer satisfaction or digital engagement. A rigid KPI dashboard that cannot reflect these changes, such as those found in flexible KPI dashboard examples, can blind a business to emerging opportunities or threats. The ability of a KPI dashboard to quickly update and refine KPIs in response to market shifts is crucial to building a competitive edge.
- Data Quality Challenges: As mid-market businesses grow, the data sources they rely upon become more diverse. Integrating data from various internal and external sources—such as internal CRM systems and ERP platforms or macroeconomic data—into a single, cohesive KPI dashboard can be daunting. Poor data quality or integration issues can lead to inaccurate KPIs and misguided decisions. Ensuring that data is clean, consistent, and up to date is a crucial challenge that should be addressed to fully utilize the power of KPIs.
- Data Consistency: Another issue with data is input inconsistency, leading to conflicting KPIs, which can confuse decision-makers and reduce confidence in the KPI dashboard. Businesses must invest in robust data governance practices to ensure that the data feeding into their KPIs is reliable. This involves implementing data validation protocols and standardizing data from various sources. Regular audits can also improve data integrity.
- Employee Engagement with KPIs: The human element poses a critical challenge for mid-market businesses. Employees at all levels must fully engage with and understand KPIs’ importance. A key performance indicator dashboard is only as effective as the people who use it. If employees do not know how KPIs relate to their roles or if the dashboard is too complex for them, there will be no benefit. It is important to provide ongoing training and support to ensure that users can interpret and use the data presented in the KPI dashboard.
- Data-Driven Culture: Businesses must also foster a data-driven culture where KPIs are made part of everyday decision-making. This involves training and encouraging an environment where data is valued and used consistently across the organization. Regularly reviewing KPIs in team meetings, celebrating successes based on KPI achievements, and encouraging feedback on KPI dashboard usability—using insights from KPI dashboard examples—are all ways to promote this culture.
The Eight Essential Features of KPI Dashboards
1. Dashboard Customization and Flexibility
A versatile KPI dashboard is the backbone of effective decision-making in mid-market businesses, where diverse teams operate with varying objectives. Customization is of crucial importance here. Your dashboards should allow different departments to tailor the display of KPIs according to their specific goals and responsibilities. For example, the sales department might prioritize KPIs like lead conversion rates and revenue per salesperson, while the finance team may consider KPIs like cash flow, operating expenses, and profitability ratios.
The degree of customization extends to how data is presented in dashboards. Flexible layouts, where users can drag and drop widgets, resize charts, and create personalized dashboards, ensure that the KPI dashboard reflects each team’s unique workflow and focus.
Moreover, the ability to adjust performance metrics on the fly is crucial. As business priorities shift, the KPIs being tracked should also be adjusted. A dynamic KPI dashboard software allows for quick reconfiguration of KPIs without needing technical support, empowering teams to stay agile and responsive to changing conditions. Visualization options, such as heatmaps for financial risks or funnel charts for sales pipelines, further enhance the ability of teams to interpret complex data at a glance, making KPI dashboards a truly indispensable tool across the organization.
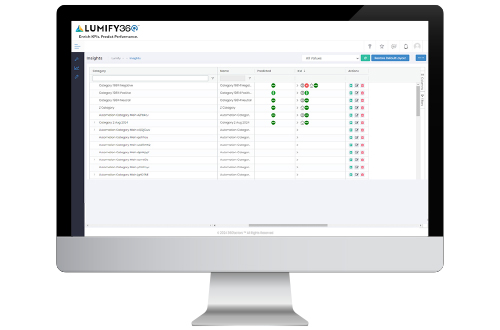
2. Real-Time Data Integration
To successfully compete and make timely decisions, businesses must get access to real-time data. The best KPI dashboards seamlessly integrate internal and external data sources, providing a comprehensive, up-to-the-minute view of business performance. For mid-market businesses, this means pulling data from various systems—like your CRM, ERP, and marketing platforms—or external sources like Federal Reserve Economic Data (FRED) and National Center for Health Statistics (NCHS)—into a single, cohesive dashboard.
Take, for example, a manufacturing business that needs to track inventory levels in real-time while monitoring production data and warehouse supply chain status. A KPI dashboard that integrates these data streams allows the company to respond instantly to production inefficiencies, adjust procurement strategies, and optimize delivery schedules. Incorporating external data, such as industry benchmarks or economic indicators, adds another layer of depth. This enhances KPI accuracy and provides context, helping businesses measure their performance against broader market trends.
Real-time integration also enables businesses to update KPIs continuously, ensuring that decision-makers always work with the latest information. This can lower the risk of basing critical business decisions on outdated data, ultimately improving the speed and accuracy of business responses to market changes.
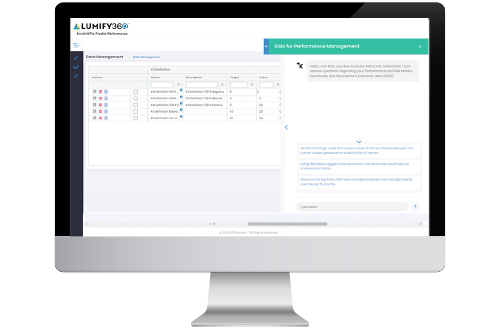
3. A User-Friendly Interface
The true power of a key performance indicator dashboard lies in how accessible and easy to use it is to everyone in the organization. A user-friendly interface is especially useful for mid-market businesses because most users will not necessarily be data experts. The KPI dashboard should be designed with intuitive navigation, labels that make sense, and visual clarity to ensure that users can quickly find and interpret the data they need.
For instance, color-coded indicators can immediately signal performance levels—green for on-target, yellow for caution, and red for areas needing attention—allowing users to grasp the status of key metrics at a glance. Interactive elements, such as hover-over tooltips and clickable data points, can provide deeper insights without overwhelming the user with information upfront.
Great KPI dashboard tools also integrate AI-driven features such as copilots or generative AI, allowing users to interact with the dashboard in natural language. For example, users can simply ask, “What were our top-performing products this quarter?” and the AI will generate a relevant chart or report. This reduces the learning curve for non-technical users and democratizes access to data interpretation, enabling more informed decision-making across all levels of the organization.
4. Advanced Analytics and Predictive Insights
Mid-market businesses must move beyond static data reports to stay competitive with large corporations. Advanced analytics and predictive insights are essential features of KPI dashboards that help bridge the gap in technical expertise. Features like trend analysis allow KPI dashboard users to identify patterns, assisting medium-sized organizations in understanding the underlying factors that drive performance.
For example, an insurance business might use trend analysis to observe seasonal fluctuations in policy renewals and claims, enabling the company to optimize premiums and marketing efforts accordingly. Predictive modeling takes this further by forecasting future performance based on historical data. Imagine predicting client turnover and taking proactive steps to retain high-value clients before they leave. By leveraging machine learning algorithms and insights from KPI dashboard examples, an advanced KPI dashboard can identify subtle correlations and trends that might not be immediately apparent, providing a strategic advantage.
Advanced data analytics is not just about identifying what is happening but also helps businesses understand why and what might happen next. This depth of insight allows companies to anticipate challenges, seize opportunities early, and make data-driven decisions that propel growth.
5. KRI-Adjusted KPIs
The business environment is becoming increasingly complex, and managing risks is as important as driving performance. KRI-adjusted KPIs integrate Key Risk Indicators directly into your performance metrics, providing a more balanced view of your business’s health. For instance, a financial institution might track loan default rates as a KRI alongside loan profitability KPIs for more comprehensive performance tracking. By integrating risk factors, the KPI dashboard offers a more extensive analysis that considers performance and potential threats.
This dual focus ensures that while your business is pushing forward on its performance objectives, it is also vigilant about potential pitfalls. KRI-adjusted KPIs enable companies to react to risks as they arise and anticipate and mitigate them proactively. This approach is particularly valuable in highly regulated industries, such as healthcare and finance, where compliance and risk management are critical components of business performance.
Moreover, including KRIs in your KPI dashboard promotes a culture of risk awareness across the organization. When teams see how their performance metrics are intertwined with risk indicators, they can make more informed decisions that balance growth with caution, ultimately leading to more sustainable success.
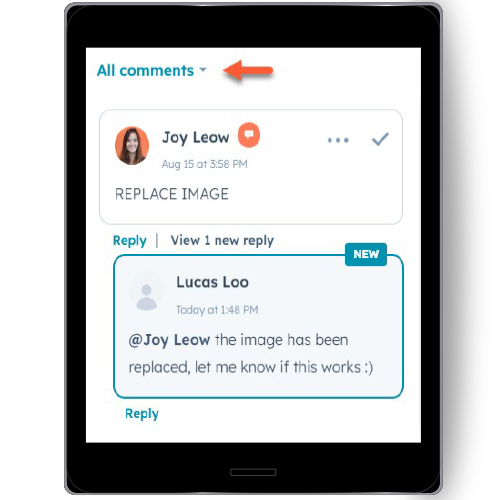
6. Collaboration and Communication
A well-designed KPI dashboard should facilitate cross-functional team collaboration. In mid-sized businesses, departments are generally small, and inter-departmental teams often need to work together. A collaborative KPI dashboard can streamline operations and improve outcomes. Features such as shared dashboards and a unified data repository, where multiple users can view and interact with the same data, make aligning objectives and tracking collective progress easier.
For example, suppose a mid-scale manufacturing business is looking to launch a new product. The marketing, sales, production, and design teams will be looking to monitor the same set of KPIs related to customer engagement, sales volume, and supply chain performance. This shared visibility ensures that all teams are on the same page, reducing data silos and promoting a unified approach to achieving overall business goals.
Adding communication tools like comment sections or task and role assignments directly into the KPI dashboard enhances collaboration. Teams can discuss data insights, assign follow-up actions, and provide updates—all within the context of the KPI dashboard. This can save time and ensure that decisions are made based on a comprehensive understanding of the data, leading to more coordinated and effective strategies.
7. Automation of Manual Tasks
For mid-market businesses, where resources are often limited, efficiency is crucial to compete with larger organizations successfully. Automating manual tasks within the KPI dashboard can significantly reduce the burden of routine processes, freeing up personnel to focus on more strategic initiatives. This can be done by automating data collection from various sources, generating reports on a scheduled basis, or even setting up notifications and alerts when certain KPIs reach critical thresholds.
For example, a healthcare business might automate the tracking of inventory levels and sales data, allowing the KPI dashboard software to create a reorder task when levels drop below a certain point. This reduces the risk of running out of stock and minimizes the time spent monitoring inventory manually or ordering.
Automation also plays a critical role in ensuring data accuracy. Reducing the dependency on manual data entry decreases the likelihood of human errors, resulting in more reliable KPIs. This level of automation ensures that your KPI dashboard remains a source of truth for your business, providing accurate, real-time data you can trust for decision-making.
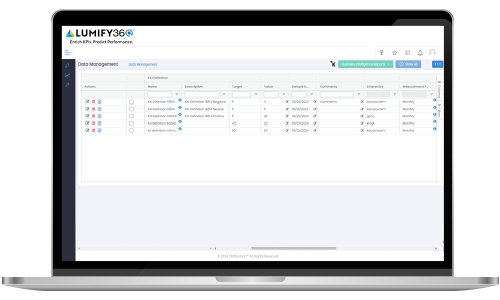
8. Scalability and Integration
As businesses mature and expand, their needs evolve, and their KPI dashboards should improve as well. The dashboard’s scalability ensures that users can accommodate increased data volume, perform more complex analysis, and cater to a growing number of users without sacrificing performance. A scalable KPI dashboard allows businesses to continue using the same tool as they expand, avoiding the disruption of switching to new systems.
For instance, as a financial business grows from regional to national operations, the complexity of its products may increase, requiring dashboards to handle more data sources and provide more detailed analytics. By drawing from scalable KPI dashboard examples, a flexible dashboard can seamlessly integrate these new requirements, allowing the business to maintain continuity in its KPI tracking and decision-making processes.
Integration is equally important. A good KPI dashboard easily connects with various tools and systems already in use, such as CRM platforms, accounting software, and marketing automation tools. This integration ensures that all the critical data flows into a central location, providing a holistic view of business performance. Moreover, by integrating with external data sources—like industry benchmarks or economic indicators—the KPI dashboard can provide context to business KPIs, helping organizations understand how their performance stacks up against competitors and market conditions.
Conclusion
Elevate Your KPI Management for Success
The right KPI dashboard software can be the difference between managing your business and truly driving it forward to success. In this guide we’ve covered the eight essential features that a high-performing KPI dashboard should have: from the flexibility of customization to the power of real-time data integration from advanced predictive analytics to automation and scalability. These features are quickly becoming necessary for mid-market businesses aiming to stay competitive, efficient, and responsive to the shifting market dynamics.
Is It Time to Upgrade Your KPI Dashboard?
As your business evolves, so should the tools you use to manage it. If your current KPI dashboard lacks essential features, consider an upgrade. Investing in a robust, feature-rich KPI dashboard software can unlock new levels of insight, streamline operations, and ultimately drive better business outcomes. The right dashboard doesn’t just track performance; it empowers your teams, aligns your strategy, and supports your business growth.
Ready to transform your KPI management? Lumify360 offers a robust, scalable KPI dashboard solution for mid-market businesses. Whether you’re looking to improve decision-making, integrate risk into your performance metrics, or get more out of your data, Lumify360 has the tools and expertise to help you succeed.
- Explore Lumify360: Discover how our platform can meet your unique business needs.
- Request a Demo: See Lumify360 in action and learn how it can elevate KPI management.