Running a business in today’s business environment is a complex art of juggling various responsibilities simultaneously – objectives to achieve, projects to track, staff to manage, and more. With so many things happening at once, it is challenging to keep everything running smoothly; that’s where the role of a KPI dashboard comes in. It’s the best tool for monitoring key metrics, enabling you to make instant, informed decisions without overlooking information. A key performance indicator dashboard is not just a beautiful display; it’s a practical way to analyze business performance without endless meetings and constant report revisions.
Are you looking for guidance on how to build a KPI dashboard? If so, you’re in the right place! A KPI dashboard brings all critical metrics into a centralized location, clearly showing where you’re performing well and where improvements are needed. Building a KPI dashboard might initially seem overwhelming, but with the right approach, it can be straightforward and highly rewarding. In this blog, we will walk through eight steps to create a KPI dashboard for data-driven decisioning.
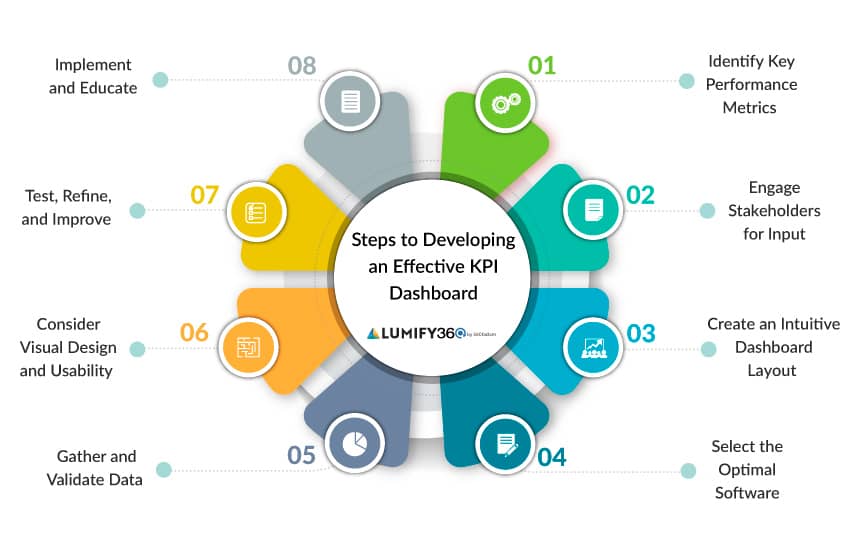
8 Steps to Developing an Effective KPI Dashboard
Step 1: Determine Key Performance Metrics
The first step in building a KPI dashboard is identifying the Key performance indicators (KPIs) that will track your business’s health and progress. This foundational step may seem straightforward, but it requires a deep understanding of your organization’s priorities and goals.
Start by asking yourself and your team about your business’s success terms. Do you want to focus primarily on customer satisfaction, financial growth, and operational efficiency, or a combination of all of these? Each organization has unique needs, so your key performance indicator dashboard should be customized to meet your organization’s strategic and operational goals.
Step 2: Engage Stakeholders for Input
A KPI dashboard that serves your organization effectively needs input from the people who will use it. When brainstorming how to build a KPI dashboard that meets all stakeholders’ needs, engaging with users across diverse teams and management is critical.
Start by identifying key stakeholders, such as managers, department heads, and team leaders. These individuals can provide insights into which metrics are crucial for their teams and how the data should be presented. For example, the sales team may need real-time insights on lead conversion rates, while the finance team may focus on profitability metrics.
Step 3: Design an Intuitive Dashboard Layout
At this point, with finalized KPIs and stakeholder input in hand, the next step is to work on the design layout of the dashboard. When thinking about how to build a KPI dashboard layout, consider that more than the visual arrangement of data—think about creating a user experience that makes accessing and interpreting information as simple as possible for your stakeholders.
An intuitive key performance indicator dashboard layout should prioritize the most critical metrics, placing them in prominent positions for easy viewing. For example, a top-level KPI that provides an overview of business performance can be featured at the top, with more detailed metrics presented below.
Step 4: Select the Optimal Software Platform
Choosing the right software platform is essential in building a KPI dashboard. The platform you select will determine the functionality of your dashboard, how well it integrates with your existing systems, and its scalability for future needs. Many options are available, so it’s important to conduct an in-depth analysis of each platform’s strengths and weaknesses. Key factors to consider include:
- Flexibility and Customization
- Integration Capabilities
- User-Friendliness
- Scalability
- Security and Compliance
Step 5: Gather and Validate Data
With your software platform in place, the next step is to gather the data that will feed into your KPI dashboard. This step is crucial because the quality of your data directly impacts the reliability and accuracy of your dashboard. Start by identifying the data sources needed for your key performance indicators. These sources may include spreadsheets, databases, third-party applications, and cloud-based systems. After gathering the data, ensure it is validated. Data validation involves checking for inconsistencies, errors, or outdated information that could skew your KPI metrics.
Step 6: Focus on Visual Design and Usability
With your validated data in hand, the next step is to focus on how to build a KPI dashboard that tells a compelling story to your stakeholders. Visual design is critical because it turns raw data into easily understandable insights. Consider the following principles when designing your dashboard’s visual elements:
- Use clear and concise visualizations
- Maintain a consistent design throughout the dashboard
- Ensuring the dashboard is accessible to all users
- Incorporate interactive elements in your KPI dashboard where appropriate
- Provide context by including labels, legends, and annotations
- Highlight the most important data points
Step 7: Test, Refine, and Improve
Before rolling out the dashboard company-wide, it’s important to test it with a small group of users. Testing allows you to gather feedback on clarity, usability, and relevance, helping you identify any problems or areas for improvement. During this phase, encourage users to interact with the pilot KPI dashboard as they would in their daily work. Ensure they perform tasks such as analyzing trends, tracking progress toward goals, and identifying areas of concern. Pay close attention to any challenges they encounter, like difficulty finding relevant information or interpreting visualizations.
Step 8: Implement and Educate
Once the KPI dashboard has been refined based on user feedback, it’s time to roll it out across the company. However, implementation isn’t complete just by making the dashboard available—you must also ensure users know how to use it effectively. Consider organizing training sessions or providing instructional guides to help users get up to speed quickly. This might include a walkthrough of the KPI dashboard layout, key features, and tips for interpreting data.
We hope you have enjoyed learning these foundational tips for how to build a KPI dashboard. Happy dashboarding and analyzing!
Sign up for Industry Insights and be the
first to know about Lumify360’s enhancements!
Maximize KPI Accuracy and Predict Performance with Business Analytics
Accurately tracking and predicting KPI performance is critical for making informed decisions in today’s competitive environment. Enhancing both the accuracy and predictive power of your KPIs can elevate your data-driven decision-making to new levels. This is where modern data analytics platforms like Lumify360 can make a big impact. Lumify360 is designed to empower business executives by providing real-time, actionable analytics that go beyond traditional data tracking. With Lumify360, you don’t need to worry about how to build a KPI dashboard—it can be customized to your priorities. Additionally, it transforms siloed and unstructured data into cohesive insights enriched with external market data.