Table of Contents
- How Business Intelligence and Business Analytics Drive Business Success
- Why Mid-Market Organizations Need BI & BA
- Key Benefits of Business Intelligence & Business Analytics for Mid-Market Organizations
The Evolution of Business Intelligence & Analytics
- Early 2000s: The Rise of Self-Service BI & Data Visualization
- 2010s: Transition to Cloud-Based BI & Big Data Analytics
- 2020s–Present: Emergence of AI-Driven BI, Automation & Embedded Analytics
Business Intelligence vs. Business Analytics: Key Differences
- Key Characteristics of BI
- Key Characteristics of BA
- Key Differences Between BI and BA
- When to Use BI vs. BA
How Business Intelligence & Business Analytics Complement Each Other
How BA and BI Transform Data into Actionable Insights
- Converting Raw Data into Business Intelligence
- Identifying Trends, Risks, and Opportunities
- Driving Performance Improvement Through BI & BA
- From Insights to Action: Implementing Data-Driven Strategies
Implementing BA and BI Applications in Your Organization
Key Steps to Successfully Implement BI & BA in Any Organization
Core Features of an Effective BA & BI Solution
- Real-Time Dashboards and Data Visualization
- Predictive Analytics & Machine Learning
- Data Integration & Automation
- Self-service Analytics & AI-powered Insights
- Security & Compliance Capabilities
How Lumify360 Transforms Business Analytics & BI for Mid-Market Organizations
- Seamless Integration with Multiple Data Sources
- AI-driven Predictive Analytics Without the Complexity
- Customizable Dashboards & Real-Time Reporting
- Embedded Power BI for Advanced Visualizations
- AI-powered Data Companion – Kaia
- Risk-adjusted KPI Tracking for Proactive Decision-Making
- Cost-effective and Scalable for Growing Businesses
- A Comprehensive Solution for Business Organizations
Introduction
In today’s fast-paced and competitive business environment, organizations can no longer rely on intuition or outdated reports to make critical decisions. Data-driven decision-making is the foundation for sustainable growth and operational efficiency. Businesses that successfully leverage data analytics can gain a significant competitive advantage by identifying trends, mitigating risks, and optimizing processes for better outcomes.
It must be noted that raw data alone is not enough—organizations must have the right tools to analyze, interpret, and act on data effectively. This is why the fields of Business Intelligence (BI) and Business Analytics (BA) have emerged, which can help businesses unlock meaningful insights from their data.
How Business Intelligence and Business Analytics Drive Business Success
BI and BA transform complex datasets into actionable intelligence, allowing businesses to:
- Monitor performance in real-time – Dynamic dashboards can provide up-to-date insights into key metrics.
- Identify inefficiencies and optimize operations – Data-driven insights often highlight areas for cost reduction and process improvements.
- Predict market trends and customer behavior – AI-powered analytics are being used to anticipate future opportunities and risks.
- Ensure compliance and risk management – Advanced analytics can enable organizations to stay ahead of regulatory requirements and mitigate risks.
Why Mid-Market Organizations Need BI & BA
Large enterprises have entire departments dedicated to data analytics and benefit from sophisticated BI and BA tools. In comparison, mid-market organizations often face challenges such as:
- Limited resources and IT expertise – Traditional analytics solutions require dedicated data teams, which mid-sized businesses usually lack.
- Data silos across departments– Without seamless data integration, organizations struggle to get a unified view of their performance.
- Complex implementation and high costs – Many BI and BA platforms are designed for large corporations, making them expensive and difficult to use for growing organizations.
By leveraging modern, AI-powered BI & BA solutions designed specifically for them, mid-market businesses can overcome these challenges, gain enterprise-level analytics capabilities, and make more informed decisions without needing a large data science team.
Key Benefits of Business Intelligence & Business Analytics for Mid-Market Organizations
Implementing a comprehensive BI and BA strategy provides mid-sized enterprises with:
- Improved Decision-Making – Make data-backed choices instead of relying on intuition.
- Operational Efficiency – Automate reporting, streamline workflows and eliminate redundancies.
- Better Risk Management– Identify and mitigate risks before they escalate.
- Competitive Advantage – Stay ahead of market trends and customer demands.
- Scalability – Grow your analytics capabilities as your business expands.
As businesses generate increasing amounts of data, those that fail to implement scalable AI-driven BI and BA solutions risk falling behind. This guide explores how BI and BA have evolved, how they differ and complement each other, and how modern businesses can implement these tools to unlock data-driven success.
The Evolution of Business Intelligence & Analytics
Over the past two decades, BI and BA have transformed from static reporting tools into dynamic, AI-driven platforms that enable real-time decision-making. This evolution has been propelled by advancements in cloud computing, big data, machine learning, and automation, allowing businesses to extract actionable insights more efficiently than ever before.
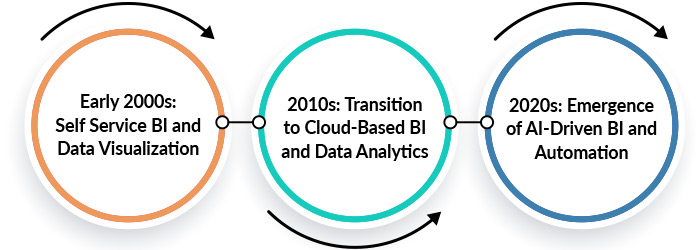
Early 2000s: The Rise of Self-Service BI & Data Visualization
In the early 2000s, BI systems were predominantly IT-driven, requiring specialized technical teams to manage databases and generate reports. This centralized approach often led to bottlenecks and delayed decision-making. To address these challenges, self-service BI tools emerged, empowering business users to access and analyze data independently.
Key developments during this period included:
- Introduction of Dashboards and Data Visualization Tools: Platforms like Tableau and QlikView made it easier for users to visualize and interpret data without deep technical expertise.
- Growth of Data Warehouses: Organizations began centralizing their data repositories, facilitating more efficient historical data analysis.
Despite these advancements, BI during this era remained primarily descriptive, focusing on analyzing past performance without providing predictive insights.
2010s: Transition to Cloud-Based BI & Big Data Analytics
The 2010s marked a significant shift as businesses increasingly adopted cloud computing and big data analytics. This transition enabled more scalable, flexible, and cost-effective BI solutions.
Notable trends from this decade include:
- Cloud BI Adoption: Services such as Microsoft Power BI and AWS QuickSight offered cloud-based BI capabilities, reducing the need for on-premises infrastructure.
- Big Data Analytics: The ability to process and analyze vast amounts of structured and unstructured data became a reality, providing deeper insights into customer behavior and market trends.
- Mobile BI and Real-Time Analytics: The proliferation of smartphones and tablets allowed decision-makers to access real-time data on-the-go, enhancing responsiveness and agility.
- Emergence of Predictive Analytics and Machine Learning: Organizations began leveraging statistical models and machine learning algorithms to forecast future trends and inform strategic planning.
This era also saw the convergence of BI and BA, with businesses recognizing the value of integrating historical data analysis with predictive modeling to drive comprehensive decision-making. (source: TechTarget)
2020s–Present: Emergence of AI-Driven BI, Automation & Embedded Analytics
In the current decade, BI and BA have evolved into sophisticated, AI-powered ecosystems that facilitate proactive and real-time decision-making.
Key advancements include:
- AI-Powered BI Tools: Modern platforms incorporate artificial intelligence to automate data analysis, generate insights, and even suggest actionable recommendations.
- Embedded and Augmented Analytics: Analytics capabilities are now integrated directly into business applications, providing users contextual insights within their existing workflows.
- Hyper-Automation and Decision Intelligence: The automation of complex business processes, combined with advanced analytics, enables organizations to make informed decisions with minimal human intervention.
- Integration of KPI-Enriched Risk Intelligence: Businesses are combining key performance indicators with risk assessments to develop strategies that are both performance-driven and risk-aware.
- Adoption of Cloud and Hybrid BI Solutions: Organizations leverage a mix of on-premises and cloud-based BI tools to create flexible, scalable analytics environments.
The 2020 pandemic accelerated the evolution of analytics as organizations sought agile and responsive BI solutions to navigate unprecedented challenges. That period underscored the necessity for real-time data analysis and the ability to adapt swiftly to changing circumstances.
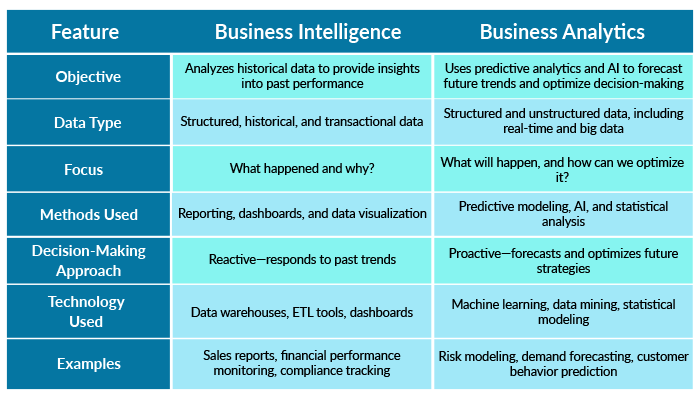
Business Intelligence vs. Business Analytics: Key Differences
BI and BA are often used interchangeably in conversation, but they serve distinct purposes in an organization’s data-driven decision-making strategy. While BI focuses on understanding historical performance through reporting and visualization, BA leverages predictive modeling and advanced analytics to forecast future trends and optimize strategies. Understanding the differences between the two can help organizations determine when and how to use them effectively.
Key Characteristics of BI
Business Intelligence refers to the processes, tools, and technologies used to collect, store, and analyze historical data to improve decision-making. BI primarily offers descriptive analytics, which means it helps organizations understand what has happened in the past and why.
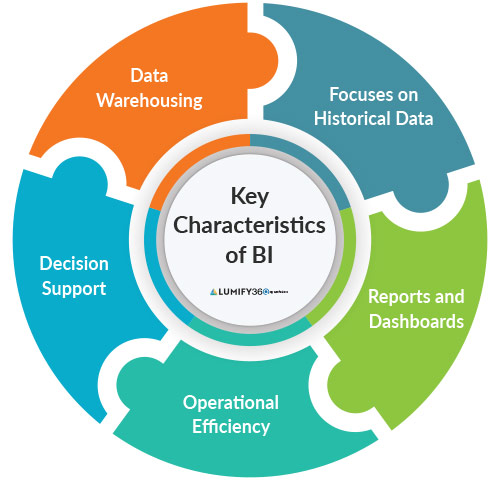
Key characteristics of BI include the following.
- Focuses on Historical Data: BI tools aggregate and analyze past data to identify trends and patterns.
- Reporting & Dashboards: BI solutions generate interactive dashboards and visual reports to present data in an easily understandable format.
- Operational Efficiency: BI improves day-to-day operations by providing real-time visibility into key performance indicators (KPIs).
- Decision Support: BI aids in strategic decision-making by providing insights into past performance.
- Data Warehousing & ETL (Extract, Transform, Load): BI systems rely on structured data stored in data warehouses for analysis.
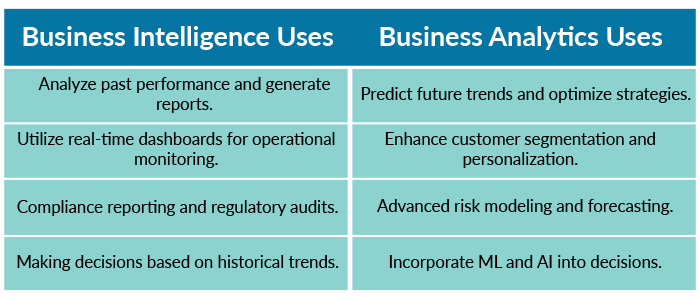
Common Use Cases of BI:
- Monitoring financial performance through real-time dashboards.
- Sales and marketing analysis to track customer behavior and conversion rates.
- Regulatory compliance reporting in industries like banking and healthcare.
- Identifying operational inefficiencies in supply chain management.
Key Characteristics of BA
Business Analytics is a broader discipline that includes predictive analytics, prescriptive analytics, and data mining to uncover patterns and forecast future outcomes. Unlike BI, which is retrospective, BA is forward-looking, enabling organizations to anticipate trends and make proactive business decisions.
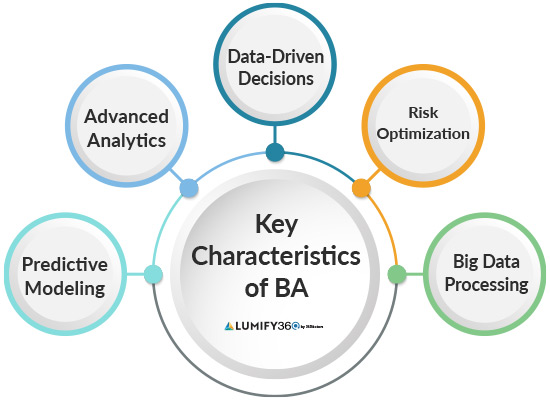
Key Characteristics of BA include the following.
- Predictive Modeling: BA uses statistical models and machine learning algorithms to predict future trends.
- Advanced Data Analytics: BA goes beyond reporting to perform in-depth data analysis and pattern recognition.
- Data-Driven Decision Making: BA empowers organizations to use data to drive strategy rather than just reporting on past events.
- Risk Analysis & Optimization: BA helps businesses mitigate risks and optimize processes using simulation and forecasting.
- Unstructured & Big Data Processing: BA often involves analyzing large, unstructured data sets, including text, images, and real-time data streams.
Common Use Cases of BA:
- Risk modeling in banking and finance to detect fraud and assess credit risk.
- Customer segmentation in marketing to personalize offers and campaigns.
- Predictive maintenance in manufacturing to reduce downtime and improve efficiency.
- Healthcare analytics for disease prediction and patient outcome optimization.
Key Differences Between BI and BA
Key differences between BI and BA include the following.
When to Use BI vs. BA
Here’s a comparison of when to leverage BI versus BA.
How Business Intelligence & Business Analytics Complement Each Other
While BI and BA serve distinct purposes, they are most powerful when used together. BI provides the foundation by organizing and visualizing historical data, while BA builds upon it by applying predictive and prescriptive analytics to guide future decision-making. When combined, BI and BA enable organizations to leverage their data more effectively, leading to improved operational efficiency, strategic planning, and business growth.
The Synergy Between BI and BA in Data-Driven Decision-Making
Organizations that integrate BI and BA create a comprehensive data strategy to:
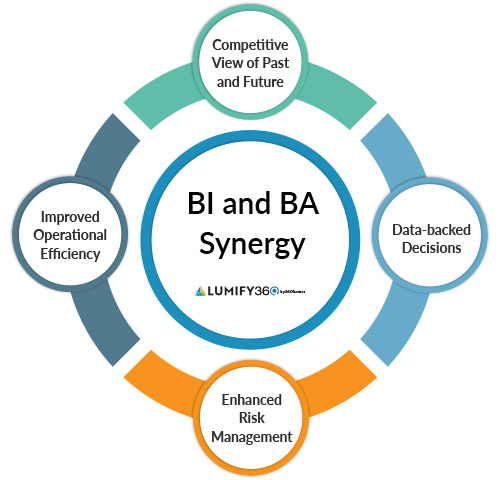
- Gain a complete view of past and future trends: BI helps organizations track historical performance and identify patterns, while BA applies predictive analytics to forecast future trends and behaviors.
- Make faster, data-backed decisions: BI automates reporting and monitoring, ensuring decision-makers always have real-time insights, while BA simulates scenarios and recommends optimal strategies to enhance decision-making.
- Improve risk management: BI enables businesses to monitor Key Risk Indicators (KRIs), while BA helps predict potential risks and recommend mitigation strategies.
- Enhance operational efficiency: BI tracks real-time KPIs, helping organizations identify inefficiencies, while BA suggests ways to optimize processes and reduce costs.
How BA and BI Transform Data into Actionable Insights
Modern organizations generate vast amounts of data, but this data may remain underutilized without the right tools and software solutions. BI and BA are crucial in converting raw data into meaningful insights that drive strategic decision-making. This section explores how BI and BA work together to transform complex data into actionable outcomes.
Converting Raw Data into Business Intelligence
Before data can generate value, it must be structured, analyzed, and visualized effectively. BI tools aggregate data from multiple sources, such as internal databases, customer interactions, and third-party applications, transforming it into meaningful dashboards and reports.
Key Steps in Data Transformation:
- Data Collection: Gathering structured and unstructured data from various internal and external sources
- Data Cleansing: Removing inconsistencies, duplicate entries, and errors to ensure accuracy
- Data Integration: Merging different data sources into a unified platform
- Data Visualization: Presenting data through interactive dashboards and reports
Example Use Case: A retail chain can collect data from in-store sales, e-commerce transactions, and social media engagement. BI dashboards may be used to compile this information into real-time reports, helping executives monitor sales performance across different regions.
Identifying Trends, Risks, and Opportunities
Business Analytics goes beyond reporting by applying predictive and prescriptive analytics to uncover trends, forecast risks, and recommend actions. By identifying patterns in historical data, BA helps businesses anticipate future challenges and opportunities.
How BA Enhances Business Insights:
- Trend Analysis: Detects shifts in customer behavior, market demand, and operational performance
- Risk Identification: Predicts potential operational, financial, and compliance risks
- Opportunity Detection: Highlights areas for growth, cost-saving, and efficiency improvements
Example Use Case: A manufacturing company may apply BA models to analyze supply chain data, predicting potential delays due to geopolitical disruptions or raw material shortages. By forecasting these risks, the company can adjust inventory levels to prevent production slowdowns.
Driving Performance Improvement Through BI & BA
Organizations leverage BI and BA to optimize processes, improve efficiency, and enhance decision-making. Key areas where businesses see transformation include:
- Customer Experience Enhancement: Personalized recommendations, targeted marketing campaigns, and optimized pricing strategies
- Operational Efficiency: Streamlined workflows, predictive maintenance, and automated reporting
- Financial Optimization: Fraud detection, cost reduction, and revenue forecasting
Example Use Case: A bank may integrate BA and BI to analyze customer spending habits and offer targeted financial products based on predictive insights. This data-driven approach improves customer engagement while increasing cross-sell and upsell opportunities.
From Insights to Action: Implementing Data-Driven Strategies
Collecting and analyzing data is only valuable when businesses act upon these insights. The final step in data transformation involves decision-making and execution.
Key Steps in Actionable Decision-Making:
- Data Interpretation: Understanding insights generated from BI & BA reports
- Strategic Planning: Aligning insights with business goals
- Execution: Implementing changes based on data-driven recommendations
- Continuous Monitoring: Tracking performance metrics to refine strategies over time
Example Use Case: A healthcare provider can use BA to analyze patient data and predict potential readmission risks. Based on these insights, doctors may implement personalized treatment plans that improve patient outcomes and reduce hospital readmission rates.
Implementing BA and BI Applications in Your Organization
The successful adoption of BI and BA depends on understanding industry-specific needs, selecting the right tools, and integrating data-driven processes into everyday decision-making. Different industries leverage BA and BI in unique ways to optimize operations, enhance risk management, and improve customer experiences. Below, we explore how BI and BA applications drive transformation in key industries.
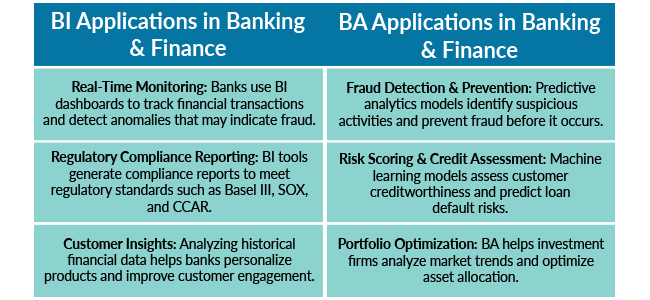
Banking & Finance
Financial institutions manage vast amounts of transactions, customer, and compliance data daily. BI and BA solutions help banks and financial firms enhance risk management, improve operational efficiency, and ensure regulatory compliance
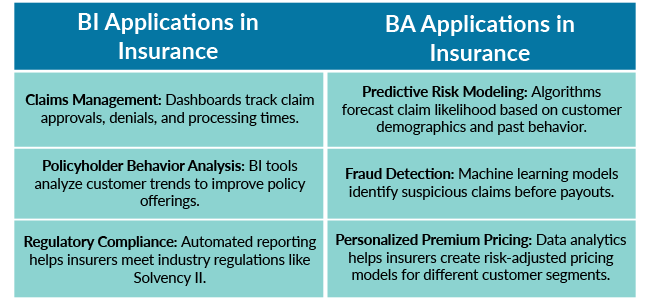
Insurance
The insurance sector heavily relies on data-driven decision-making to assess risks, optimize pricing models, and detect fraudulent claims.
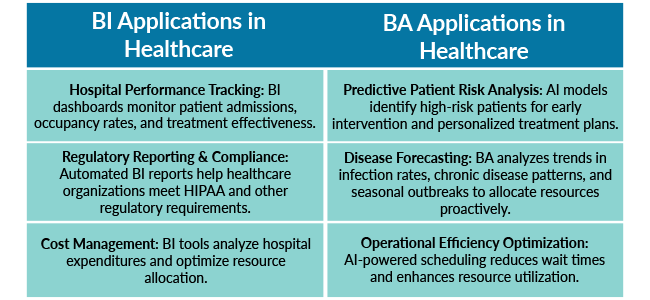
Healthcare
In healthcare, data-driven decision-making enhances patient care, operational efficiency, and regulatory compliance. BI and BA solutions help healthcare providers improve medical outcomes and optimize hospital management.
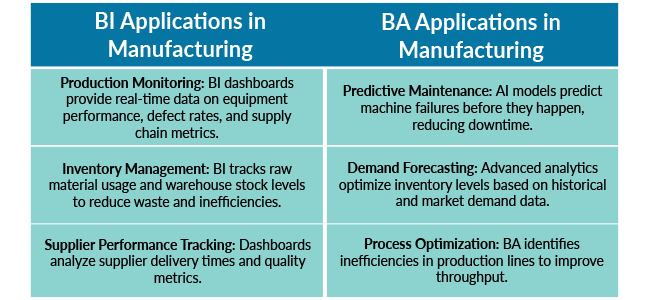
Manufacturing
Manufacturers use BI and BA to improve supply chain visibility, minimize production risks, and enhance product quality.
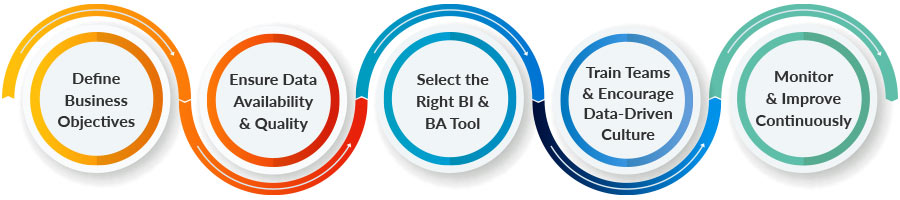
Key Steps to Successfully Implement BI & BA in Any Organization
Define Business Objectives – Identify key goals, such as improving decision-making, optimizing operations, or enhancing customer experiences.
Ensure Data Availability & Quality – Integrate structured and unstructured data from multiple sources for a holistic view.
Select the Right BI & BA Tool – Choose solutions that align with business needs, such as Lumify360 for mid-market businesses.
Train Teams & Encourage Data-Driven Culture – Educate employees on using analytics for better decision-making.
Monitor & Improve Continuously – Regularly assess BI and BA effectiveness and refine strategies based on evolving needs.
Core Features of an Effective BA & BI Solution
A robust Business Analytics and Business Intelligence solution must have a mix of real-time data accessibility, predictive capabilities, automation, and security to empower organizations with actionable insights. Some of the core features that define an effective BI and analytics solution include the following:
Real-Time Dashboards and Data Visualization
Real-time dashboards provide an at-a-glance view of key metrics, ensuring decision-makers have the latest data available. Data visualization tools transform raw data into easy-to-understand charts, graphs, and reports for better interpretation.
Key Benefits:
- Quick identification of trends and anomalies
- Enhanced decision-making with up-to-date insights
- Improved stakeholder communication through visually compelling reports
Example Use Case: A financial institution can use a real-time BI dashboard to monitor KRIs and compliance metrics, allowing risk managers to address potential issues before they escalate.
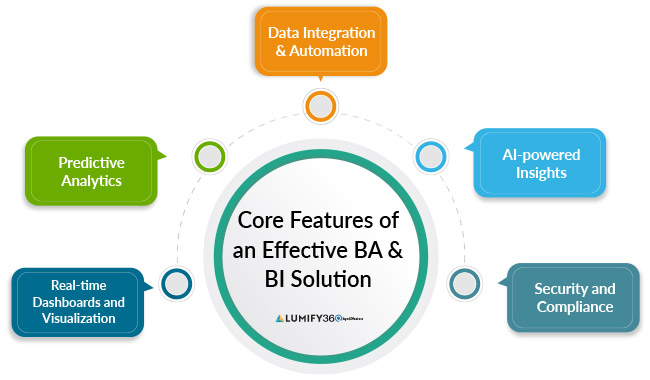
Predictive Analytics & Machine Learning
Overview: Predictive analytics leverages historical data to forecast future trends, risks, and opportunities. Machine learning (ML) models identify patterns that may be difficult for human analysts to detect, automating complex decision-making.
Key Benefits:
- Data-driven forecasting for proactive business strategies
- Reduction in risks through early identification of potential issues
- More accurate customer behavior predictions to enhance engagement
Example Use Case: An insurance company uses predictive analytics to assess the likelihood of claims fraud, identifying suspicious patterns before payouts are made.
Data Integration & Automation
Overview: A modern BI solution must seamlessly integrate data from various sources such as ERP, CRM, cloud applications, and third-party APIs. Automation reduces manual data processing, ensuring faster reporting and fewer errors.
Key Benefits:
- Unified data view across different departments and systems
- Increased operational efficiency by reducing human intervention
- Faster decision-making with automated report generation
Example Use Case: A manufacturing firm integrates supply chain data from IoT sensors, production lines, and supplier databases to optimize inventory levels and prevent bottlenecks.
Self-service Analytics & AI-powered Insights
Overview: Self-service BI allows business users to access, analyze, and generate reports without relying on data analysts or IT teams. AI-powered insights provide automated recommendations based on patterns in data.
Key Benefits:
- Empowers business users to explore and analyze data independently
- Reduces IT dependency and improves overall agility
- AI-driven insights enhance decision-making by highlighting key trends and opportunities
Example Use Case: A marketing team uses a self-service BI tool to analyze campaign performance in real-time, adjusting ad spending dynamically based on engagement trends.
Security & Compliance Capabilities
Overview: Ensuring data security and regulatory compliance is critical for any BI solution, especially in regulated industries like finance, healthcare, and insurance. Features such as role-based access controls (RBAC), encryption, and audit trails help protect sensitive information.
Key Benefits:
- Protects sensitive customer and business data from breaches
- Ensures compliance with regulations like GDPR, HIPAA, and SOC 2
- Provides accountability through detailed audit logs
Example Use Case: A healthcare organization uses BI tools with built-in compliance features to track patient records securely while meeting HIPAA privacy standards.
How Lumify360 Transforms Business Analytics & BI for Mid-Market Organizations
Mid-market organizations need enterprise-grade insights but often lack the budget, dedicated data teams, or infrastructure required for complex analytics solutions. Lumify360 bridges this gap by offering a scalable, AI-driven analytics platform that simplifies data-driven decision-making for mid-sized businesses.
Seamless Integration with Multiple Data Sources
One of the biggest hurdles mid-market businesses face is managing disparate data sources—spreadsheets, CRM systems, ERP platforms, and third-party market data. Lumify360’s powerful data integration capabilities allow businesses to:
- Unify structured and unstructured data from multiple platforms, creating a single source of truth.
- Eliminate data silos by connecting real-time operational data with historical performance metrics.
- Enable cross-functional collaboration, allowing finance, sales, marketing, and operations teams to access consistent insights.
AI-driven Predictive Analytics Without the Complexity
Unlike traditional BI tools that focus only on historical reporting, Lumify360 integrates predictive analytics powered by AI and machine learning to help mid-market businesses:
- Anticipate market trends and customer behavior with advanced forecasting models.
- Identify operational inefficiencies before they impact business performance.
- Automate data analysis, reducing reliance on IT teams and enabling faster decision-making.
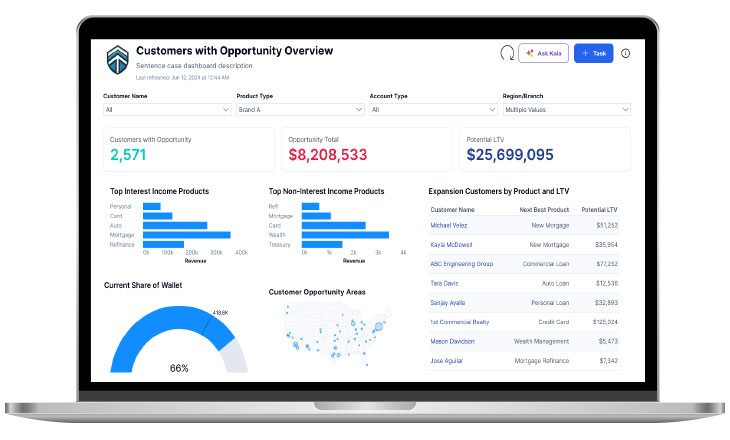
Customizable Dashboards & Real-Time Reporting
Many BI tools offer generic reports that may not align with a mid-market company’s unique needs. Lumify360 provides:
- Interactive, customizable dashboards tailored to specific KPIs and business goals.
- Real-time analytics that update instantly as new data flows in, ensuring decisions are based on the latest insights.
- Role-based access controls allow different teams to view the most relevant insights without overwhelming them with unnecessary data.
Embedded Power BI for Advanced Visualizations
As part of its commitment to providing a modern analytics experience, Lumify360 integrates Microsoft Power BI, offering:
- Advanced visualizations that make complex data easy to interpret.
- Self-service analytics, allowing non-technical users to explore data without needing a dedicated analyst.
- Seamless integration with Microsoft tools, making it ideal for businesses already using Office 365 or Azure.
AI-powered Data Companion – Kaia
Many mid-market businesses lack in-house data expertise, which can make leveraging BI & BA tools challenging. Lumify360 includes Kaia, an AI-powered data companion, to:
- Answer complex analytical queries in natural language—users can simply ask questions like, “What are my top-performing product categories?”
- Provide instant insights and recommendations, reducing time spent on manual data exploration.
- Guide users through analytics workflows, making it easier to uncover actionable intelligence.
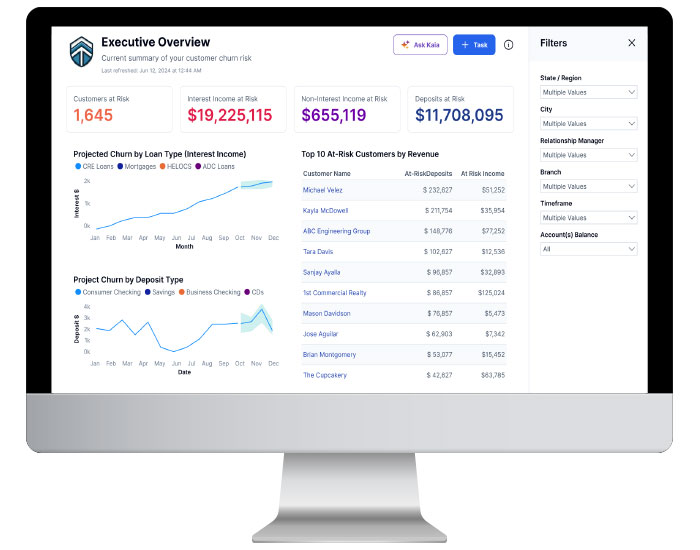
Risk-adjusted KPI Tracking for Proactive Decision-Making
Unlike traditional KPI tracking, Lumify360 enhances decision-making by incorporating risk-adjusted performance metrics, allowing mid-market businesses to:
- Identify hidden risks impacting business performance before they escalate.
- Prioritize actions based on real-time risk-weighted insights rather than static reports.
- Align operational decisions with risk management strategies, ensuring sustainable growth.
Cost-effective and Scalable for Growing Businesses
Mid-market businesses need enterprise-grade analytics without enterprise-level costs. Lumify360 is designed to be:
- Scalable—grows with your business, allowing for more data sources and users as needed.
- Cloud-based, reducing IT overhead and infrastructure costs.
- Subscription-based pricing, ensuring affordability without upfront capital investments.
A Comprehensive Solution for Business Organizations
For mid-market businesses looking to unlock the full potential of their data, Lumify360 offers a game-changing solution that combines:
- BI dashboards for historical insights
- BA-powered predictive analytics for future trends
- AI-driven automation for faster, smarter decision-making
By eliminating data silos, simplifying complex analytics, and embedding AI-driven insights, Lumify360 empowers mid-sized organizations to compete with larger enterprises—without the high costs or technical barriers.
Conclusion
The evolution of BI and BA has transformed how organizations leverage data for strategic decision-making. AI-powered analytics, real-time insights, and predictive modeling empower businesses to move beyond static reporting and gain a deeper understanding of risks, opportunities, and market trends. Lumify360 simplifies this transition, offering seamless Power BI integration, AI-driven insights, and scalable cloud-based analytics tailored for mid-market organizations.
By adopting an advanced BI & BA platform, businesses can eliminate data silos, enhance collaboration, and unlock actionable insights that drive efficiency, growth, and competitive advantage. Whether it’s risk assessment, operational optimization, or performance tracking, the right analytics solution enables organizations to stay ahead in an increasingly data-driven landscape.
Take the Next Step
Explore how Lumify360 can revolutionize your approach to Business Intelligence and Analytics. With real-time monitoring, AI-powered insights, and an intuitive interface, Lumify360 ensures you always have the right information at the right time to make data-driven, strategic decisions.
Take the first step toward smarter analytics and business intelligence:
- Explore Lumify360: Discover how our platform enhances BI & BA for mid-sized enterprises.
- Request a Demo: See Lumify360 in action and learn how it can elevate your decision-making.